Predicting Foreign Box Office for Movies
For project #2 at Metis we were supposed to scrape data from the internet and use it to predict something with a linear regression model. I decided to try to predict a movie’s total foreign box office, as well as what genres are more popular in certain other countries relative to others.
Step 1: Adventures with Scrapy
We learned several different methods for web scraping, including BeautifulSoup, Selenium, and Scrapy. I decided to go with Scrapy, as it seemed to be more powerful than BeautifulSoup, and I wasn’t scraping any dynamically generated content that would require Selenium. I wrote a script that pulled the following features from boxofficemojo for each movie in the top 200 grossing movies for the years 2010-2016 (1400 movies total):
- Title
- Domestic Total Gross
- Distributor
- Release Date
- Genre
- Runtime
- Budget
- Total Foreign Gross
- Opening Weekend
- Widest Release
- Days In Theaters
- Foreign Countries with Reported Gross
- Gross for each Country
Writing a web scraper was pretty cool! It was a bit tedious troubleshooting all of the XPaths, but once it worked I felt like this:
Step 2: Clean Up Clean Up Everybody Everywhere
Sadly boxofficemojo does not include budget for a lot of movies, which mean dropping around half my movies. I could have scraped farther back, but since I was trying to predict foreign gross I didn’t want any sort of geopolitical changes to have too much of an effect on my findings. I thought going back to 2010 was fair – it was post financial crisis, which meant little inflation.
I then wrote a few helper functions to clean up my data, such as functions that converted strings to money (ints and floats), converted strings to datetime objects, and organized genres from around 100 different values into 9 broader categories.
Step 3: Explore!
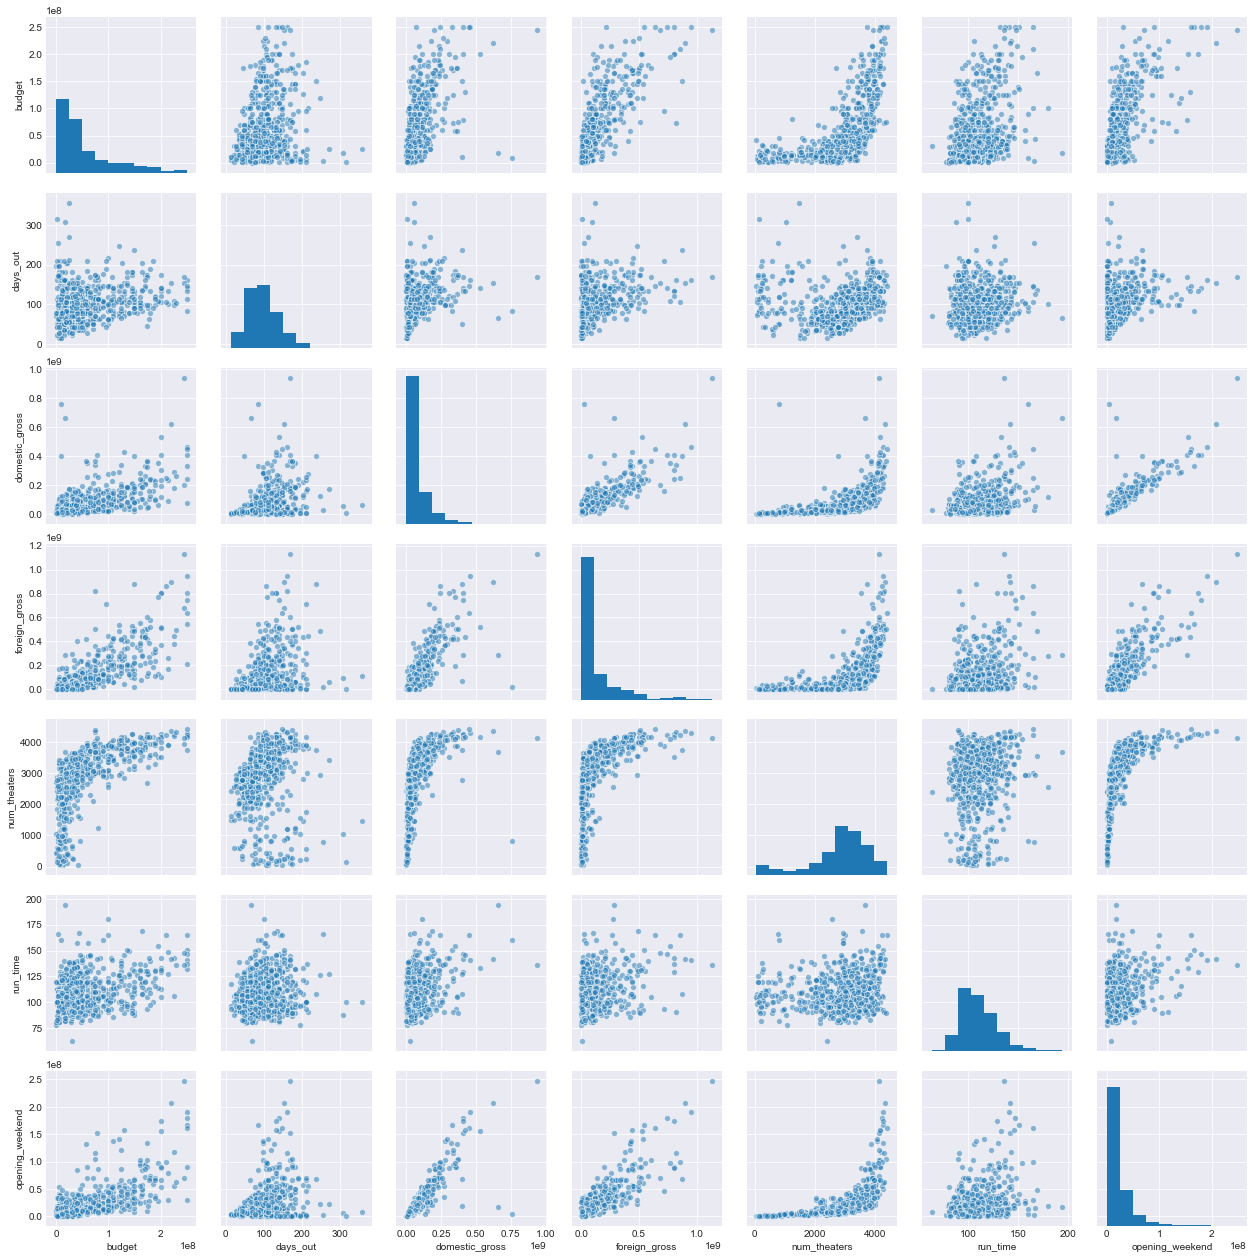
This is a pairplot of all of the numerical variables:

A few takeaways / issues:
- The money variables are not normally distributed
- Domestic gross and opening weekend are highly collinear
- Runtime has almost no relationship with anything
- The number of theaters and any of the gross variables have a sort of exponential relationship
How I decided to deal with these issues:
- I did a whole separate analysis after log transforming these variables, and while this was probably more “academically” correct (fewer linear regresssion assumptions were violated), I was more focused on the interpretation of my model, so keeping everything as-is was easier to interpret. Plus, I only had money variables in the end, so at least they still varied together
-
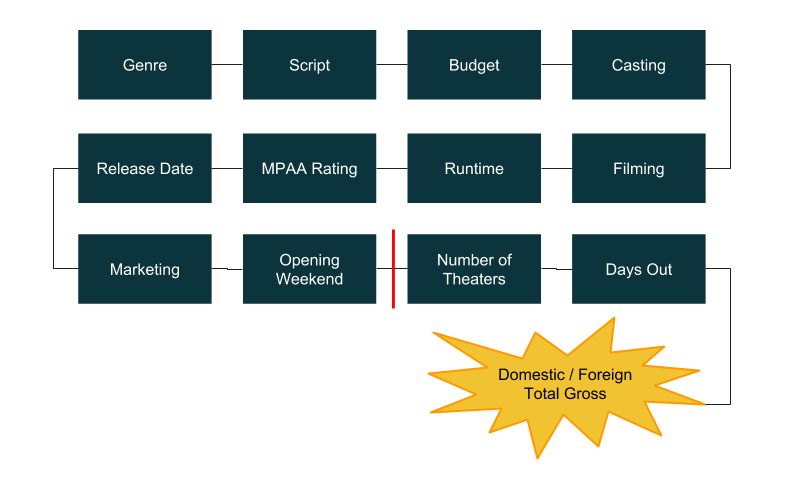
I decided not to use domestic gross in my model. If the below is the trajectory of a movie, my cutoff point for prediction was the red line. Basically I didn’t think it was fair to use total domestic gross and other things to predict total foreign gross when you couldn’t know total domestic gross before the movie was released

- I decided not to use runtime as a feature
- The number of theaters got eliminated from my feature set because of #2 above, but I thought this relationship was interesting nonetheless. It suggests that movies that are released to fewer than around 3,000 theaters make roughly the same amount of money, but once you hit that 3,000 theater threshold movies start to make more money. I also found it interesting that there didn’t seem to be any diminishing returns on the number of theaters, I guess because movie producers already know the optimal number of theaters in which to release their films!
Step 4: Feature Selection
My initial set of features were budget, opening weekend, genre (8 categories), distributor (9 categories, i.e., Disney/Buena Vista, Universal), MPAA rating (G, PG, PG-13, R), and month of release. I ran an OLS model using both statsmodels and sklearn with all of the features predicting total foreign gross and got a of 0.80 on all of the data and a cross-validated of 0.75. This told me that my model was probably not overfitting, which is not surprising given I only had two numerical variables. Still, I wanted to see if I could eliminate features and streamline my model. I tried eliminating different combinations of distributor, rating, and month, and found that if I took out all of them my adjusted was 0.78 versus 0.80, so I decided to do that for my model.
Step 5: The Model
My final sklearn OLS model included only the features budget, opening weekend, and genre, and my cross-validated
was 0.77. I got the below coefficients as well:
- Intercept: -$20 million
- Budget: 1.067
- Opening weekend: 3.093
- Comedy: -$16,414,922
- Documentary: -$16,281,281
- Drama: -$5,895,403
- Family: $37,196,306
- Horror: $2,471,289
- Other: $8,575,768
- Thriller: -$10,026,560
- Action-Adventure: $374,803
So, basically to find a movie’s total foreign gross, take its budget, add 3 times its opening weekend, and make a small tweak for genre!
How did the model do?
Plot of sorted residuals:

For the middle 500 movies, my model does pretty well, within ~$50 million of the actual foreign gross amount. However, on the ends, my model underpredicts some movies by as much as $480 million and overpredicts by as much $260 million! The 5 most underpredicted movies were Frozen, Ice Age: Continental Drift, Minions, Transformers: Age of Extinction, and Skyfall. I suppose it’s hard to quantify the universal appeal of these family movies, and of course James Bond. Transformers is a bit surprising, though, given that my 5 most overpredicted movies were all action-adventure films: Oz The Great and Powerful, Man of Steel, Batman vs. Superman: Dawn of Justice, The Hunger Games, and Green Lantern. I think these movies had exceptionally high opening weekends.
But what about individual countries?
To answer my original question, what genres are more popular in certain countries relative to other countries, I decided to focus on comedy. I was surprised that in the general model, comedy had a negative effect on total foreign gross. I figured most people would like comedy, but then again perhaps something about American comedy doesn’t translate well to other languages and cultures.
To get a sense of this, I ran my OLS model on each country in my dataset that had 400 or more movies reporting in that country. It ended up being 47 countries total. Then for each country I found its coefficient for comedy in the model, and created a choropleth map of the coefficients, where red means a negative effect and blue means a positive effect.
The mean for the countries’ models was 0.51, so take this with a grain of salt, but I still think we can draw some interesting generalizations from the map. For one thing, Latin America is generally reddish, in addition to France and Spain. Perhaps American humor does not translate well from English to the Romance Languages. On the other hand, Australia and South Africa are bluer, and they are English speaking countries. But the U.K. is very negative, maybe because British people are known for a specific kind of humor! Again, I wouldn’t read too much into the individual coefficients, but if I am a movie studio and I am planning to release a comedy, I would have some sense of which countries it will do better in versus others. This model and map could be extended for more genres as well!
Step 6: Final Thoughts
I thought it was pretty neat that in 2 weeks (and only 3 weeks into our data science educations), we were able to complete a project from start to finish, from scraping data to generating useful insights!